Defining Behavioral Segments
Drilling Down
Newsletter # 116: 4/2011
Drilling Down - Turning Customer
Data into Profits with a Spreadsheet
*************************
Customer Valuation, Retention, Loyalty, Defection
Get the Drilling Down Book!
http://www.booklocker.com/jimnovo
Prior Newsletters:
http://www.drilling-down.com/newsletters.htm
-------------------------------
Hi again folks, Jim Novo here.
Two questions answered this month, both about defining behavioral
segments. The first starts out with how to handle seasonality
when using Recency - Frequency scoring, but ends up driving into the
very nature of why someone would want to use behavioral scoring
in the first place.
The second brings forth an issue common when just starting out with
behavioral analysis - how to create meaningful segmentations.
Me, I wouldn't dare decide on a segmentation, I would let the
data tell me how it should be segmented.
Data speaks, no? Let's do the Drillin'...
Questions from Fellow Drillers
=====================
Defining Behavioral Segments
Q: I purchased your book and have a few questions you can hopefully help me out with.
A: Thanks for that, and sure!
Q: We have 4 product lines and 2 of them are seasonal. i.e we have customers that year in year out purchase these items consistently but seasonally, for example, every spring and summer.
Then they are dormant for Fall and Winter. Should I include these customers along with everyone else when doing an RFM segmentation?
A: Well, it kind of depends what you will using the RF(M) model for, what kinds of marketing programs will be activated by using the scores. If you know you have seasonal customers and their habit is to buy each year, AND you wish to aim retention or reactivation programs at them, I would be tempted to divide the customer base so that seasonal customers are their own segment.
Then run two RF(M) models - one for the seasonals, and one for everyone else.
Q: If I include seasonal customers, and I run RFM say on a monthly basis, these seasonal customers will climb / fall drastically with time depending on the season, so it seems like it may complicate the scoring process.
A: Sure, and you could segment as I said above. Or, you could run across a longer time frame, say across 2 - 3 years worth of data. This would "normalize" the two segments into one and take account of the seasonality in the scoring - perhaps be more representative of the business model.
However, the scores would become less sensitive due to the long time frame so the actions of customers less accurately predicted by the model.
Q: Can you provide me with some examples as to how segmentation is carried out?
Let's say I being with RFM and all my customers are rated 5-5, 5-4, 4-5 etc.
What are the next steps, do we overlay with other characteristics like age, gender, etc?
Or are the 5-3 etc. our actual segments?
A: This goes back to what you want to use the RF(M) model for.
In the standard usage, each score will have roughly the same number of customers in it, those with higher scores will be more likely to respond to marketing and purchase, lower scores less likely.
Another way to say this is: since the lower scores are less responsive, they require higher value discounts or
promotions to activate them. So you can customize offers based on score, which will provide the maximum response for the minimum discount exposure.
Try testing different discount levels with different scores to see where you get maximum profit; an example of that kind of testing and math is here:
Using Recency to Drive Promotional
Profit
The above assumes you are focused on response and profit, two of the more common objectives in data-based marketing ;)
However, other valuable information can be discovered using this framework, see chapter 20 about adding customer characteristics to
RF(M) scores. This is not needed if you are just concerned about response / profit for campaigns
- the segments are the segments.
But if you'd like to know, for example, what kind of merchandise is appealing to 5-5
(ultra-best, highest responding) customers, you could run the scoring, take the 5-5's, and then cross-tab with whatever else you have - find out what kind of merchandise they buy, what their sex is, etc. - any kind of data you have or can get on them.
This kind of work can help develop creative, decide what to feature on the home page, etc.
Q: Should we provide them a segment name like High Recent / Low Frequents, Low Frequents / Low Recents etc?
How do the other characteristics come into play with respect to the naming conventions, segmentation etc.
I keep reading of different segments like 'Loyalists', 'Laggers', are these defined through our subjectivity?
A: Generally yes, subjective labels; you may find it is easier to communicate using labels rather than scores,
so you could suggest that certain ranges of scores be called something like 'Loyalists' or 'Laggers'.
The High Recent / Low Frequents segmentation is the quadrant approach from LifeCycle mapping, see the chapter 22 in the book.
This is an alternative way to use the RF(M) variables to map your customer base in a more Strategic way than
RF(M) affords.
In other words, you could use RF(M) to score for Campaigns and the LifeCycle maps to report on your progress over time to management, since both approaches are based on the same variables - great way to "connect the dots" for manic-ment.
Also, RF(M) is a bit hard to visualize just using the scores; the LifeCycle maps allow you to plot campaign results in a very visual, easy to understand
display of the data.
See these newsletters for a deeper explanation of Strategic versus Tactical use of RF scoring:
RFM versus LifeCycle Grids
LTV, RFM, LifeCycles - the Framework
Hope that helps!
Jim
===================
Q: How do I establish the optimal number of segments / buckets I should
have when analyzing a customer database?
I was using a method of dividing them into deciles and assigning Decile 1 to Segment A, Decile 2 & 3 to Segment B, Deciles 4 - 6 to Segment c and Deciles 7 - 10 to Segment D.
However, the absolute number in each is not practical as I will not be able to manage that
number of customers in the way I need to.
A: Well, it would help to know what Kind of business this is, but in general, the most effective place to break behavioral segments is where behavior changes.
You can force people into Deciles, which often does not create meaningful segments, or you can look at the data and see where there are "bulges" or changes that seem significant.
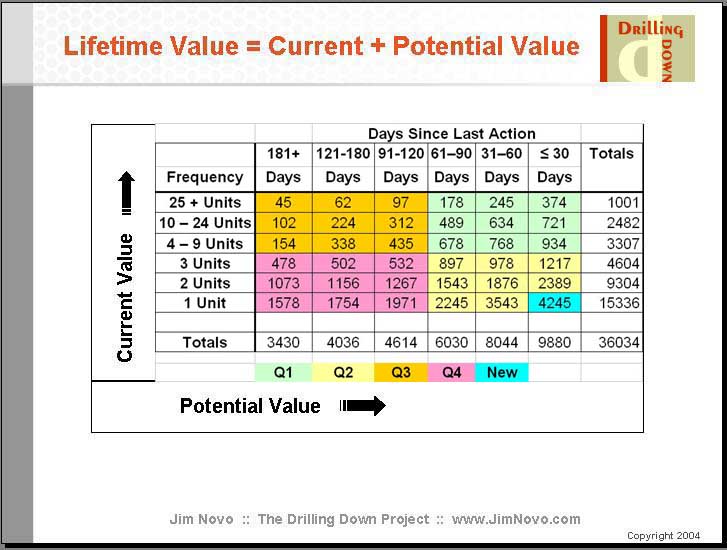
So, for example, look at this LifeCycle Grid:
Current / Potential Value Matrix
Note the low Current Value breaks of 1, 2, 3 because there are large groups of customers there.
Then, 4 - 9, because each of those has many fewer customers and their behavior is similar.
Same with 10 - 24, that's a pretty good customer comparatively, and after 25 purchases, well, they're crazy-good customers and behave similarly.
These cutoffs start out as somewhat arbitrary, but over time and testing you find out, for example, that a 9X buyer behaves more like a 5X buyer and not so much like a 10 - 24X buyer, so the cutoff is 9X.
Here's another example:
Freemium
Customer Conversion
The segments graphed in this post are actually deciles of 1
year customer value; but the data plot is of the first 14 weeks
of weekly spending. Note how there are clear inflection points
where the behavior changes, and this is where I would generally
create the "boundaries" for a segment. Doing it this
way means the segmentation already has some type of powerful
behavioral trait, making it by definition significant and
"actionable".
Hope that helps!
Jim
Have a question on Customer Valuation, Retention, Loyalty, or Defection?
Go ahead and send it to me here.
-------------------------------
Need help with creating action-oriented customer analysis or High ROI
Customer Marketing program designs? Click
here.
-------------------------------
That's it for this month's edition of the Drilling Down newsletter.
If you like the newsletter, please forward it to a friend! Subscription instructions are top and bottom of this page.
Any comments on the newsletter (it's too long, too short, topic
suggestions, etc.) please send them right along to me, along with any
other questions on customer Valuation, Retention, Loyalty, and
Defection here.
'Til next time, keep Drilling Down!
- Jim Novo
What would you like to
do now?
Get
the book with Free customer scoring software at:
Booklocker.com
Amazon.com Barnes
& Noble.com
Find
Out Specifically What is in the Book
Learn Customer
Marketing Models and Metrics (site article
list)
|